Finance & Profitability
Contribution Margin: Build a Profit Ladder Before You Scale
Calculate contribution margin by offer, test pricing and cost changes, and choose a 30-day profit experiment before adding more sales volume.
Updated 2026-09-07
Revenue tells you what customers paid. Contribution margin shows how much remains from each sale to cover fixed costs and profit—and where a practical improvement may be hiding.
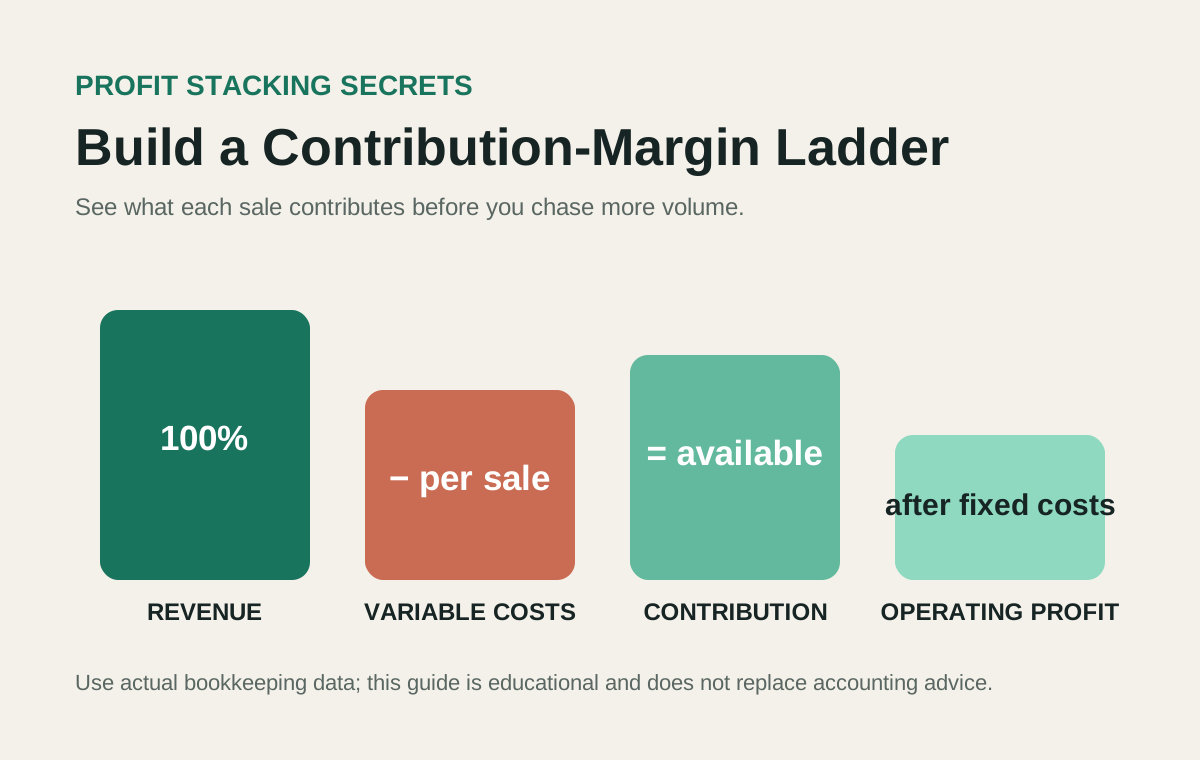
| Line | Calculation | Decision use |
|---|---|---|
| Net revenue | Sales less discounts, refunds, and sales taxes collected | Start with what the business actually retains as revenue |
| Variable costs | Materials, fulfillment, transaction fees, sales commissions, usage-based delivery | Identify costs that move when one more unit is sold |
| Contribution margin | Net revenue minus variable costs | Dollars available for fixed costs and operating profit |
| Contribution margin ratio | Contribution margin divided by net revenue | Compare offers with different prices |
| Break-even units | Relevant fixed costs divided by contribution per unit | Estimate the volume required under stated assumptions |
The short answer
Calculate contribution margin for each meaningful offer before buying more traffic or pushing the team for more volume. Begin with net revenue per sale, subtract only the costs that change because that sale happened, and compare the dollars and percentage left to cover fixed costs and operating profit.
Then run one 30-day experiment on price, discounting, fulfillment, payment cost, scope, or repeat purchase. Do not treat the spreadsheet as a forecast guarantee. It is a decision model whose usefulness depends on accurate bookkeeping, clear cost behavior, and stated assumptions.
Contribution margin is not gross margin or net profit
Gross margin usually subtracts cost of goods sold according to the business’s accounting method. Contribution margin groups costs by behavior: which costs change with another unit, customer, shipment, or transaction? Net profit then reflects fixed operating expenses, financing, taxes, and other items after the contribution has been earned.
The distinctions matter because the same expense may behave differently in different businesses. A contractor might be variable for one service and fixed-capacity for another. Ask an accountant or bookkeeper to confirm classification rather than forcing every cost into a template.
Build the worksheet from actual records
Choose one offer and one recent period. Pull invoices, refunds, discounts, payment-processor fees, product or contractor costs, shipping, packaging, usage-based software, and directly attributable commissions. Reconcile totals to the bookkeeping system before dividing by units sold.
Use net revenue, not the price printed on the sales page. Refunds and discounting can make realized revenue materially different. Keep sales tax collected for a taxing authority separate from business revenue, subject to the accounting and jurisdictional treatment confirmed by a tax professional.
Classify variable costs with a simple test
Ask: if we sold one additional unit tomorrow, would this cost increase, and by approximately how much? Card fees, shipping, packaging, per-user infrastructure, piece-rate labor, and commissions often pass the test. Rent, baseline salaries, annual insurance, and core software often do not change with a single sale.
Some costs are stepped or mixed. A support hire may be fixed until volume crosses a capacity threshold. Record that threshold separately. A model that hides capacity steps can make growth look more profitable than it will be.
Compare dollars and ratios
Contribution dollars show how much one sale contributes. The ratio shows what share of revenue remains. A high-priced offer may produce more dollars but a lower ratio; a smaller digital product may have a higher ratio but contribute too few dollars to cover acquisition and support.
Compare both measures alongside customer-acquisition cost, refund rate, repeat purchase, and capacity. No single metric should make the whole decision. The goal is to see which offer strengthens the business under realistic demand and delivery constraints.
Turn the model into a sensitivity chart
Create three cases rather than one forecast: current, conservative, and improved. Change one assumption at a time—price, units, discount rate, refund rate, variable cost, or capacity step. This shows which assumptions truly control the result.
Do not stack every optimistic assumption into the improved case. A useful scenario is possible and testable. Label assumptions and dates so a later reader can reproduce the calculation instead of inheriting a mysterious profit number.
Choose the first 30-day experiment
Start with the lever closest to the leak. If discounting is the issue, tighten approval rules and test offer framing. If fulfillment cost varies wildly, standardize scope and track exceptions. If transaction fees matter, compare lawful, customer-appropriate payment options without creating surprise charges.
Define the test before launch: the offer, audience, start and end dates, expected contribution change, guardrail metrics, and stopping rule. Guardrails might include conversion, refunds, delivery time, complaints, or customer outcomes.
Avoid three scaling traps
First, do not multiply an unverified per-unit margin by an unlimited volume assumption. Demand, staffing, inventory, service quality, and cash timing all create limits. Second, do not cut costs that protect customer results or compliance. Third, do not count tax savings, financing, or accounting treatment as operating improvement without professional review.
The SBA’s financial-management guidance emphasizes understanding statements and cash flow. Contribution margin complements that work but does not replace it. A profitable sale can still strain cash when payment arrives after inventory, labor, or taxes are due.
Review the result and stack the next improvement
At day 30, compare actual net revenue, variable cost, contribution dollars, ratio, volume, refunds, and guardrails with the baseline. Keep the change only if the economics and customer experience improved together. Document what changed and what remains uncertain.
Then choose the next smallest lever. Profit stacking works when improvements compound: a clearer offer can improve realized price, a tighter scope can protect delivery cost, better onboarding can reduce refunds, and a renewal path can increase lifetime contribution without pretending every customer behaves the same.
Educational and professional-use note
This article provides general business education, not accounting, tax, legal, investment, or earnings advice. Cost classification, revenue recognition, sales tax, worker classification, and financial reporting vary by business and jurisdiction. Use complete records and consult qualified professionals for decisions that affect filings, contracts, financing, or material commitments.
There is no guaranteed contribution-margin target and no guaranteed outcome from changing price or cost. The responsible use of the model is to clarify assumptions, run bounded tests, protect customers and compliance, and replace projections with actual results as soon as they exist.